Spillpoint Analysis for 100 Realizations
Spillpoint Analysis for 100 Realizations
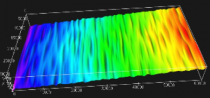
The data set contains 100 realizations for each of the 15 models, except for the flat base case. The table below shows the result of a spillpoint analysis for one realization of each model computed for an injection scenario with a single injector placed (15,15) km north-west of the lower-left corner. In each plot, the structural traps and the spillpoint path are shown in black on top of a color image showing the height of the surface. By clicking on an image, you can also view a movie showing the spillpoint analysis for all 100 realizations. (Windows users may have to view the lossy avi version).
| Unfaulted | UP1 | NP1 | UP2 | NP2 | |
|---|---|---|---|---|---|
| Flat |
 mp4 | avi |
 mp4 | avi |
 mp4 | avi |
 mp4 | avi |
|
| FMM |
 mp4 | avi |
 mp4 | avi |
 mp4 | avi |
 mp4 | avi |
 mp4 | avi |
| OSS |
 mp4 | avi |
 mp4 | avi |
 mp4 | avi |
 mp4 | avi |
 mp4 | avi |
 Hvordan komme til NR
 Del på sosiale media
 Personvernerklæring